I think statistic is a key tool providing in-depth understanding for designers on marketing, brands and clients’ needs, like researching. But this time,the information and data are on the pictures – visual.
Through self understanding and almost 140 categories which came up by whole class, team work completed well on visual statistic challenge on 11th October. All of the categories were chosen from our appearance, gender, hobbies, individual thoughts. Based on different personal background and experience, the result of visual statistics are complicate. It clearly shows on surface that the past of our life what we were been through. That might influence our personalities, characters and hobbies even our every decision. At the end of the project, we should collect information and analysehe data to get a result.
It took a long time to collect information but a essential step. Team work is supposed to be efficient but sometimes it is little bit difficult to organize 18 people at same time. I think that reason is lack of communication between peers. Fortunately, thing went well when we corporate together. During the processing, we also decided to delete some of categories due to repeating, meaningless and unfit our experience.
I understand that I should consider about ‘why do this?’, ‘what is meaning?’ before doing every project. Moreover, communication and discussion of group work are essential for team work which could make the result more precision through adjust and delete categories. At present, I am looking forward our satistic photos and figure out how to analyze them.
List of illustration
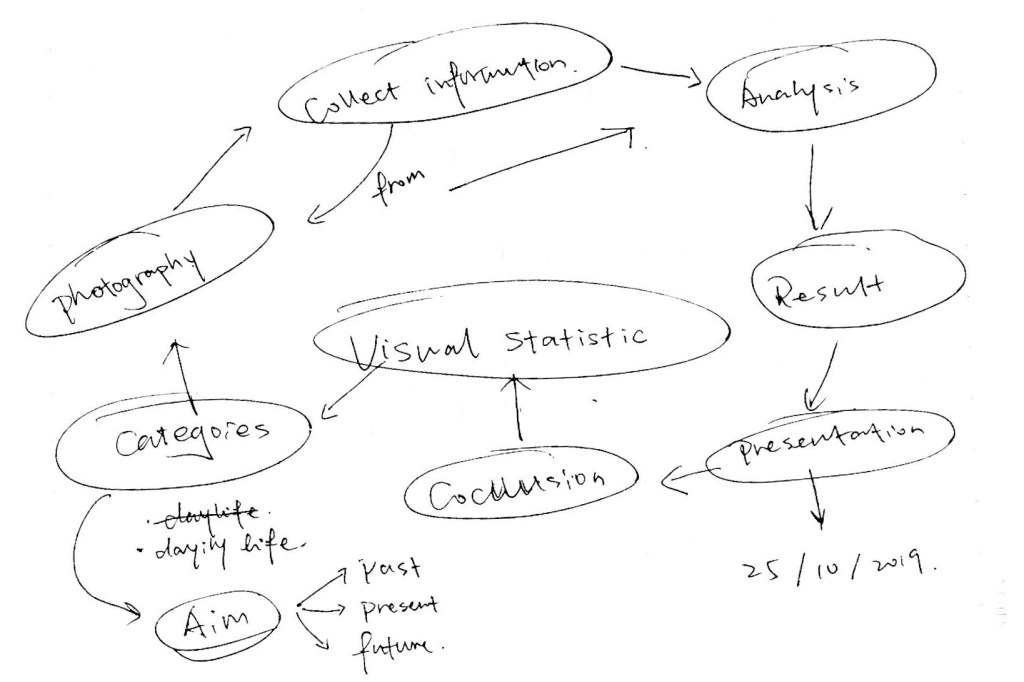
Figure1. Chen. (2019). Handwritting, https://wordpress.com/block-editor/post/chen.poetry.blog/253.
